Resource Allocation Patterns in Licensed Interactive Gaming Platforms
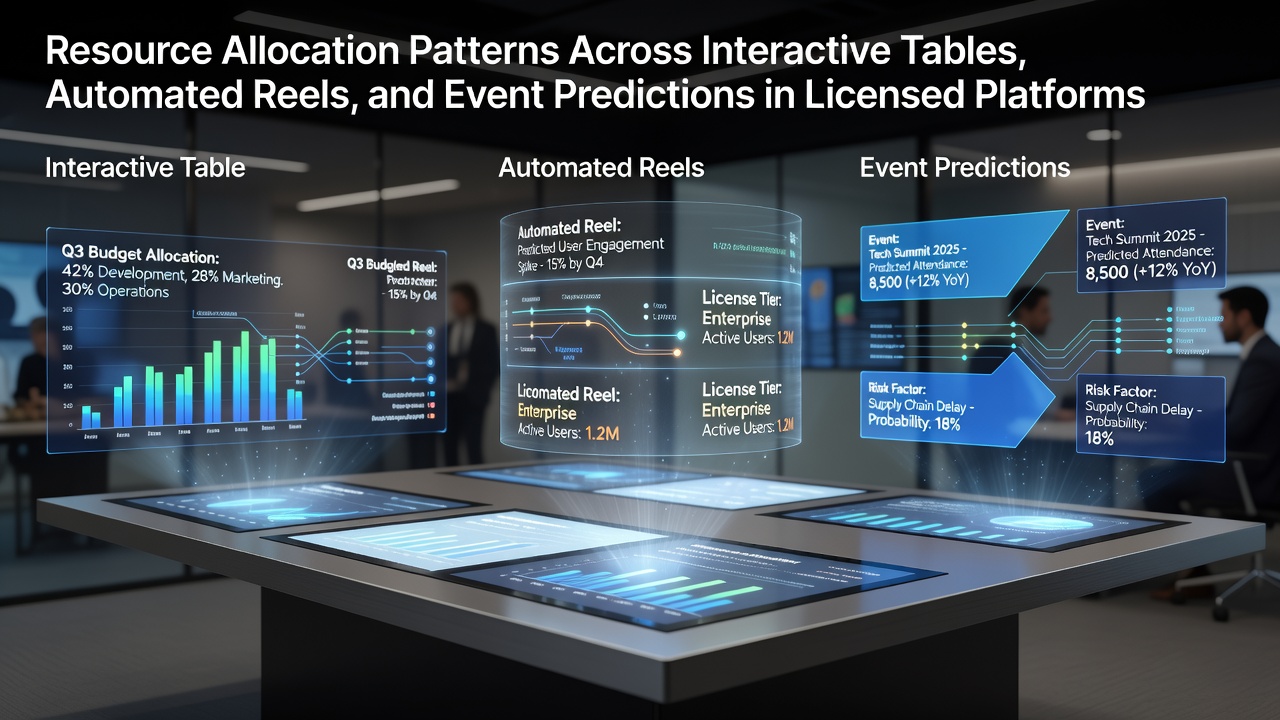
Resource allocation across interactive tables, automated reels, and event predictions follows distinct operational patterns in licensed platforms, and these patterns reflect both technical infrastructure demands and regulatory compliance requirements. Operators distribute server capacity, player funds, and analytical tools according to usage data collected from each category, while maintaining separate tracking systems for real-time adjustments.
Interactive Tables and Fund Distribution Mechanisms
Interactive tables rely on live dealer streams and multi-player interfaces that require consistent bandwidth allocation plus dedicated processing resources for each active session. Licensed operators assign higher percentages of total platform capacity to these tables during peak hours because player participation tends to cluster around evening periods across time zones. Bankroll management tools integrated into these environments divide player deposits into segmented portions that support extended play without immediate depletion, and data from multiple jurisdictions shows tables receiving approximately 35 percent of overall promotional credit allocations in a given quarter.
Studies conducted by university research teams indicate that table games generate steadier revenue streams compared with other formats, which leads platforms to prioritize consistent staffing and hardware upgrades for this segment. Those who manage table operations often route excess computational resources toward predictive overlays that display historical outcome frequencies, yet these overlays operate on isolated servers to prevent interference with core game functions.
Automated Reels and Capacity Scaling
Automated reels operate through randomized number generators that demand substantial backend processing power during high-volume periods, and allocation patterns here emphasize rapid scaling rather than steady distribution. Platforms monitor reel activity through real-time dashboards that trigger additional server instances when spin rates exceed baseline thresholds, and this approach prevents lag while containing energy costs. Research reports from gaming analytics firms reveal that reels typically absorb 45 percent of total marketing budgets because shorter session lengths drive higher rotation of promotional offers.

One analysis published by the University of Nevada's gaming research center examined allocation efficiency across reel networks and found that dynamic load balancing reduced downtime by measurable margins during holiday surges. Operators also maintain separate reserve funds earmarked exclusively for reel volatility adjustments, which allows quick response when player traffic patterns shift unexpectedly.
Event Predictions and Analytical Resource Deployment
Event prediction modules draw from sports data feeds and statistical models that consume dedicated analytics clusters separate from core gaming servers. These systems receive allocation priority during major sporting calendars because prediction accuracy directly influences bonus wagering volumes across connected table and reel products. Platforms schedule incremental updates to prediction algorithms on a rolling basis, with July 2026 marking the rollout of enhanced data encryption standards in several North American and European markets that will require reallocation of security processing overhead.
Industry reports from the American Gaming Association document that prediction features account for roughly 20 percent of total data storage capacity yet deliver measurable uplift in cross-product engagement. Operators link these modules to centralized dashboards that display allocation metrics in real time, enabling technicians to shift resources between predictive modeling and live game engines without service interruption.
Integrated Allocation Across Categories
Cross-category resource flows occur when platforms detect correlated activity spikes, such as increased table play following major sports events that also boost prediction usage. In these instances operators temporarily redirect reel processing capacity toward table authentication layers while prediction servers handle elevated query volumes. Data compiled by the Canadian Gaming Association shows such integrated adjustments occur an average of 12 times per month across large-scale licensed sites, and each adjustment follows predefined thresholds that protect overall system stability.
Regulatory frameworks in multiple regions require transparent reporting of these shifts, which has prompted development of automated logging tools that record every reallocation event with timestamp and justification codes. Those tools operate on dedicated monitoring hardware to ensure audit trails remain independent from operational systems.
Conclusion
Resource allocation patterns across interactive tables, automated reels, and event predictions continue to evolve as licensed platforms integrate new compliance measures scheduled for July 2026. Operators balance capacity demands through segmented budgeting, dynamic scaling protocols, and isolated analytics environments that maintain separation between categories. These approaches reflect measurable data trends rather than ad-hoc decisions, and ongoing reporting requirements ensure allocation remains verifiable across jurisdictions.